Data and Visualization of Making My PONS Dictionary
- UUID: 96d8b873-3c90-4b96-9d83-0e5519a99f83
As mentioned in Making Better Dictionaries for Language Learning , I have been reading through and making my own digitalized dictionaries for several years now.
Proud and at the same time ashamed that I have finally finished making my digitalized dictionary of "PONS Basiswörterbuch Deutsch als Fremdsprache". Proud because I have finally completed the very early started project. Ashamed because I didn't manage it in an efficient way.
Nevertheless, besides the very valuable German language knowledge I have gained by reading through the dictionary, the process itself is also very much worthy looking back. Even just shallowly. By shallowly, I mean only descriptive data analysis is also interesting enough. (Although the charm of data analysis is not just descriptive but more about finding interesting patterns which could be of more values.)
What do I mean by "the process itself"? Well, it means several aspects. But here, in this article, I am targetting at the timestamps of individual words I have made the screenshots. These timestamps are also time points when I have read through a word of the PONS Basiswörterbuch.
Data Analysis of Screenshot Timestamps
One great aspect of digital data is that they carry timestamps when they get created or modified. So it is for all the screenshots I have made.

By using some python scripts, I gathered the timestamps data for all the screenshots into CSV files.

Based on the metadata I gathered, there are several apsects I can look into. For example, I know I mainly did the dictionary reading in relatively long time periods without breaking inbetween if I started reading on the corresponding day, there, it makes sense that I can group the timestamps based on the time interval from timestamp x and timestamp x - 1 to get a piece of output data as the following.

It would be too much to cover all in one article, therefore, in this article, I would like to narrow it down to just one focus - the timestamps (leaving the headwords aside).
This time series data is in fact quite special as it involves more than 1 continent which results in 3 time zones in total and the time points are very much unevenly distributed. So special care is needed to deal with the time values. By using some python scripts, the UTC timestamps can be turned into locale datetime strings as the following.


Data Visualization
Time series data is a very common type of data, therefore, luckily, there are already many great libraries well made for it.
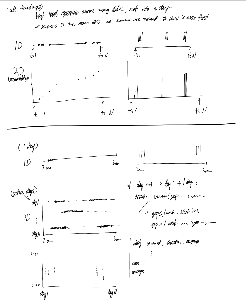
Of course, data analysis is more about ideas first. So I started forming my visualization ideas on digital pen and paper. After several revisions, t he result is as the following.

Then it is about implementation with real data.
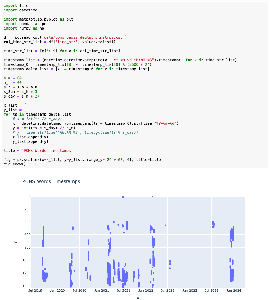
Data Visualization with matplotlib
Let's just see the result graphs with the code in it.


Matplotlib is great to make visualization only that it is too foundamental and therefore not so easy to use. For better looking graphs as well as the easy of date time handling, I went to Plotly.
Data Visualization with Plotly.py


What can I know from the graphs? At least that I know there were several times at midnight, at 0, I was still reading the dictionary and I know, I restarted the project several times.
Data Visualization with Plotly.js
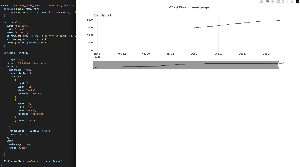
And what's best about Plotly? It is powered by JavaScript, which makes it interactive and usable on the web pages.


Timestamp: added the following interactive visualization on 20240108
PlotlyTimestampBarGraph
{
"data":[{
"x":["2019-08-30","2019-09-02","2019-09-03","2019-09-05","2019-09-06","2019-09-07","2019-09-08","2019-09-09","2019-09-10","2019-09-11","2019-09-14","2019-09-15","2019-09-16","2019-09-17","2019-09-18","2019-09-19","2019-09-20","2019-09-21","2019-09-25","2019-09-27","2019-09-28","2019-09-29","2019-09-30","2019-10-01","2019-10-06","2019-10-07","2019-10-10","2020-04-11","2020-04-12","2020-04-18","2020-04-19","2020-04-20","2020-04-28","2020-04-30","2020-05-08","2020-05-21","2020-08-24","2020-09-03","2020-09-13","2020-09-29","2021-02-20","2021-02-21","2021-02-22","2021-02-23","2021-02-24","2021-02-25","2021-02-28","2021-03-01","2021-03-02","2021-03-03","2021-03-04","2021-03-05","2021-03-06","2021-03-07","2021-03-08","2021-03-09","2021-03-10","2021-03-11","2021-03-13","2021-03-14","2021-03-15","2021-04-08","2021-04-12","2021-04-17","2021-04-18","2021-05-17","2021-05-18","2021-05-21","2021-05-23","2021-05-31","2021-06-15","2021-06-22","2021-06-23","2021-06-24","2021-06-25","2021-06-27","2021-06-28","2021-07-04","2021-07-05","2021-07-06","2021-07-07","2021-07-10","2021-07-12","2021-07-18","2021-07-19","2021-07-26","2021-07-28","2021-07-29","2021-07-30","2021-09-22","2021-09-23","2021-09-26","2021-11-02","2021-11-03","2021-11-04","2022-02-07","2022-02-08","2022-02-09","2022-02-10","2022-02-15","2022-02-17","2022-02-22","2022-02-24","2022-02-25","2022-03-03","2022-03-07","2022-03-08","2022-03-11","2022-03-12","2022-06-13","2022-07-20","2022-07-21","2023-07-11","2023-07-12","2023-07-18","2023-07-19","2023-12-01","2023-12-02","2023-12-03","2023-12-04","2023-12-05","2023-12-06","2023-12-07","2023-12-08","2023-12-09","2023-12-10","2023-12-11","2023-12-12","2023-12-13","2023-12-14","2023-12-15","2023-12-16","2023-12-17","2023-12-18","2023-12-19","2023-12-20","2023-12-21","2023-12-22","2023-12-23","2023-12-26","2023-12-27","2023-12-28","2023-12-29"],
"y":["93","112","63","59","94","112","127","57","35","38","54","45","44","62","65","43","99","83","43","41","46","59","46","11","51","35","13","34","88","73","100","22","104","12","28","3","28","37","153","52","92","68","27","43","102","58","77","66","109","23","31","72","62","71","30","62","45","71","58","57","63","29","81","46","45","1","53","108","61","15","7","31","40","69","14","63","67","5","21","18","46","1","56","94","33","70","52","43","46","31","32","36","39","26","13","28","12","12","22","20","48","16","27","114","139","25","91","86","47","3","1","34","22","13","13","13","36","27","79","60","75","104","64","111","89","70","102","137","95","107","64","123","49","102","97","65","99","100","48","43","103","101","40"]
}],
"layout":{"title":"PONS Words Timestamps (Bar of Count)"}
}
PlotlyTimestampLineGraph
{
"data":[{
"x":["2019-08-30","2019-09-02","2019-09-03","2019-09-05","2019-09-06","2019-09-07","2019-09-08","2019-09-09","2019-09-10","2019-09-11","2019-09-14","2019-09-15","2019-09-16","2019-09-17","2019-09-18","2019-09-19","2019-09-20","2019-09-21","2019-09-25","2019-09-27","2019-09-28","2019-09-29","2019-09-30","2019-10-01","2019-10-06","2019-10-07","2019-10-10","2020-04-11","2020-04-12","2020-04-18","2020-04-19","2020-04-20","2020-04-28","2020-04-30","2020-05-08","2020-05-21","2020-08-24","2020-09-03","2020-09-13","2020-09-29","2021-02-20","2021-02-21","2021-02-22","2021-02-23","2021-02-24","2021-02-25","2021-02-28","2021-03-01","2021-03-02","2021-03-03","2021-03-04","2021-03-05","2021-03-06","2021-03-07","2021-03-08","2021-03-09","2021-03-10","2021-03-11","2021-03-13","2021-03-14","2021-03-15","2021-04-08","2021-04-12","2021-04-17","2021-04-18","2021-05-17","2021-05-18","2021-05-21","2021-05-23","2021-05-31","2021-06-15","2021-06-22","2021-06-23","2021-06-24","2021-06-25","2021-06-27","2021-06-28","2021-07-04","2021-07-05","2021-07-06","2021-07-07","2021-07-10","2021-07-12","2021-07-18","2021-07-19","2021-07-26","2021-07-28","2021-07-29","2021-07-30","2021-09-22","2021-09-23","2021-09-26","2021-11-02","2021-11-03","2021-11-04","2022-02-07","2022-02-08","2022-02-09","2022-02-10","2022-02-15","2022-02-17","2022-02-22","2022-02-24","2022-02-25","2022-03-03","2022-03-07","2022-03-08","2022-03-11","2022-03-12","2022-06-13","2022-07-20","2022-07-21","2023-07-11","2023-07-12","2023-07-18","2023-07-19","2023-12-01","2023-12-02","2023-12-03","2023-12-04","2023-12-05","2023-12-06","2023-12-07","2023-12-08","2023-12-09","2023-12-10","2023-12-11","2023-12-12","2023-12-13","2023-12-14","2023-12-15","2023-12-16","2023-12-17","2023-12-18","2023-12-19","2023-12-20","2023-12-21","2023-12-22","2023-12-23","2023-12-26","2023-12-27","2023-12-28","2023-12-29"],
"y":["93","205","268","327","421","533","660","717","752","790","844","889","933","995","1060","1103","1202","1285","1328","1369","1415","1474","1520","1531","1582","1617","1630","1664","1752","1825","1925","1947","2051","2063","2091","2094","2122","2159","2312","2364","2456","2524","2551","2594","2696","2754","2831","2897","3006","3029","3060","3132","3194","3265","3295","3357","3402","3473","3531","3588","3651","3680","3761","3807","3852","3853","3906","4014","4075","4090","4097","4128","4168","4237","4251","4314","4381","4386","4407","4425","4471","4472","4528","4622","4655","4725","4777","4820","4866","4897","4929","4965","5004","5030","5043","5071","5083","5095","5117","5137","5185","5201","5228","5342","5481","5506","5597","5683","5730","5733","5734","5768","5790","5803","5816","5829","5865","5892","5971","6031","6106","6210","6274","6385","6474","6544","6646","6783","6878","6985","7049","7172","7221","7323","7420","7485","7584","7684","7732","7775","7878","7979","8019"]
}],
"layout":{"title":"PONS Words Timestamps (Line of Acc.Count)"}
}
Visualize from another perspective - timestamps considered in daily chunks, and each day is further divided into subgroups - subgroups can be aggregated (summed) among different days. Further more, days can also be categorized into different groups based on days of the week or even take holidays into account.
PlotlyGraph
{
"data":[{
"marker": {
"color": "#4876b0"
},
"name": "weekday",
"type": "bar",
"x":["0","1","2","3","4","5","6","7","8","9","10","11","12","13","14","15","16","17","18","19","20","21","22","23"],
"y":["232","27","0","0","0","0","0","0","74","371","516","237","131","134","54","31","38","163","239","359","584","694","1137","661"]
}, {
"marker": {
"color": "#004494"
},
"name": "weekend",
"type": "bar",
"x":["0","1","2","3","4","5","6","7","8","9","10","11","12","13","14","15","16","17","18","19","20","21","22","23"],
"y":["61","44","12","0","0","0","0","0","0","6","127","212","128","73","69","44","33","61","77","119","216","205","551","299"]
}],
"layout":{
"title":"PONS Words Timestamps",
"barmode": "stack"
}
}
* cached version, generated at 2024-01-08 23:44:43 UTC.


